
ng-stats AngularJS profiling tool
I found a useful tool for profiling AngularJS applications last month, it’s called ng-stats. Here is what the tool is for, taken from the GitHub page:
Little utility to show stats about your page’s angular digest/watches. This library currently has a simple script to produce a chart. It also creates a module called angularStats which has a directive called angular-stats which can be used to put angular stats on a specific place on the page that you specify.
Here’s what it looks like when you run it using the bookmarklet:
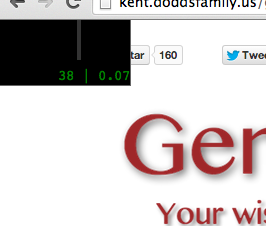
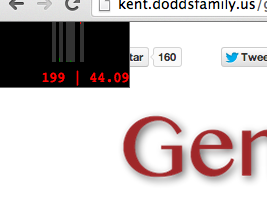
The first number is the number of watchers on the page (including , $scope.$watch, etc.). The second number is how long (in milliseconds) it takes angular to go through each digest cycle on average (bigger is worse). The graph shows a trend of the digest cycle average time.
It’s really great to watch this while you click around your app to see where the hotspots are, and places where memory management could be improved. However, you should keep in mind that in-depth profiling will be required if you want to really see where the problem spots in your application are!